Few tools in B2B are used as often and questioned as rarely as the presentation. How often it actually runs, how it is built and what happens to it after the meeting is something hardly anyone in most companies knows for sure. For our report "Present to Perform" we counted: usage data from 63 companies, from 2021 to mid-2025, tens of thousands of presentations.
The key facts in brief
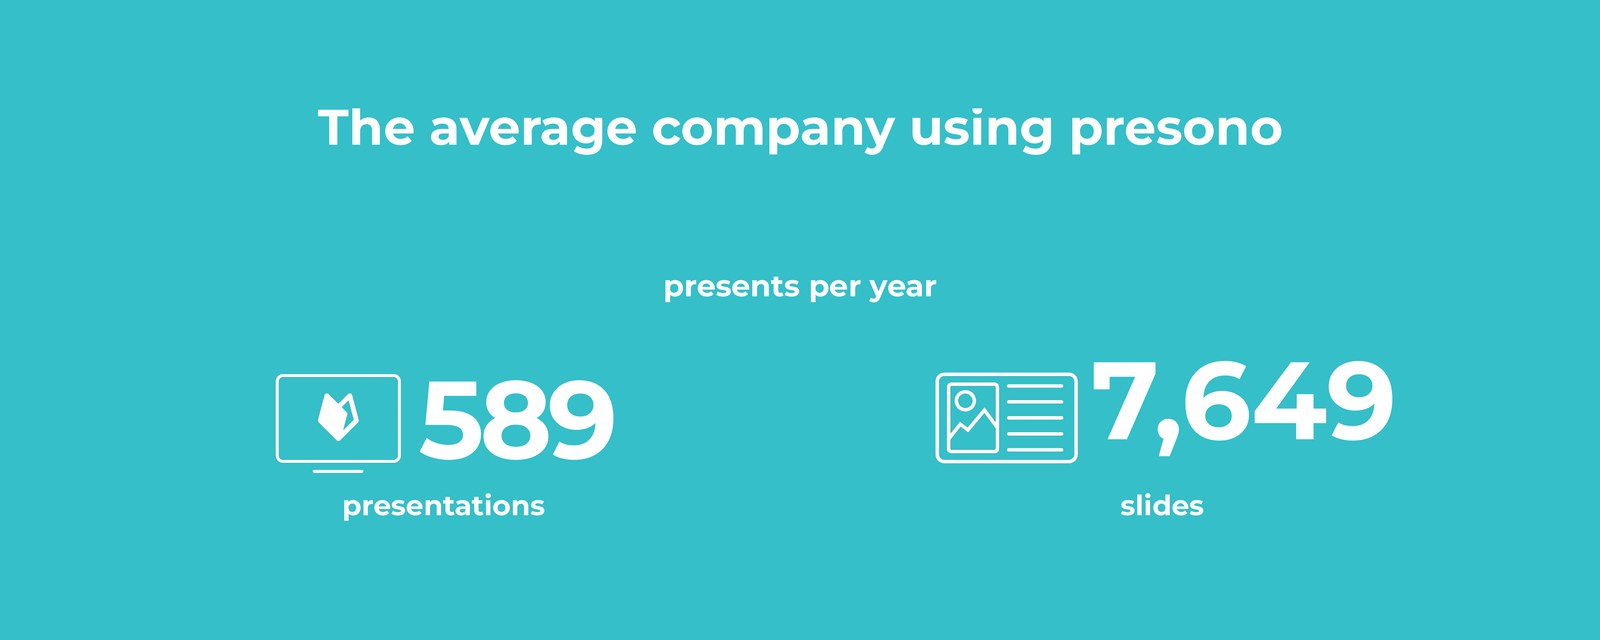
- On average, a company shows 589 presentations a year.
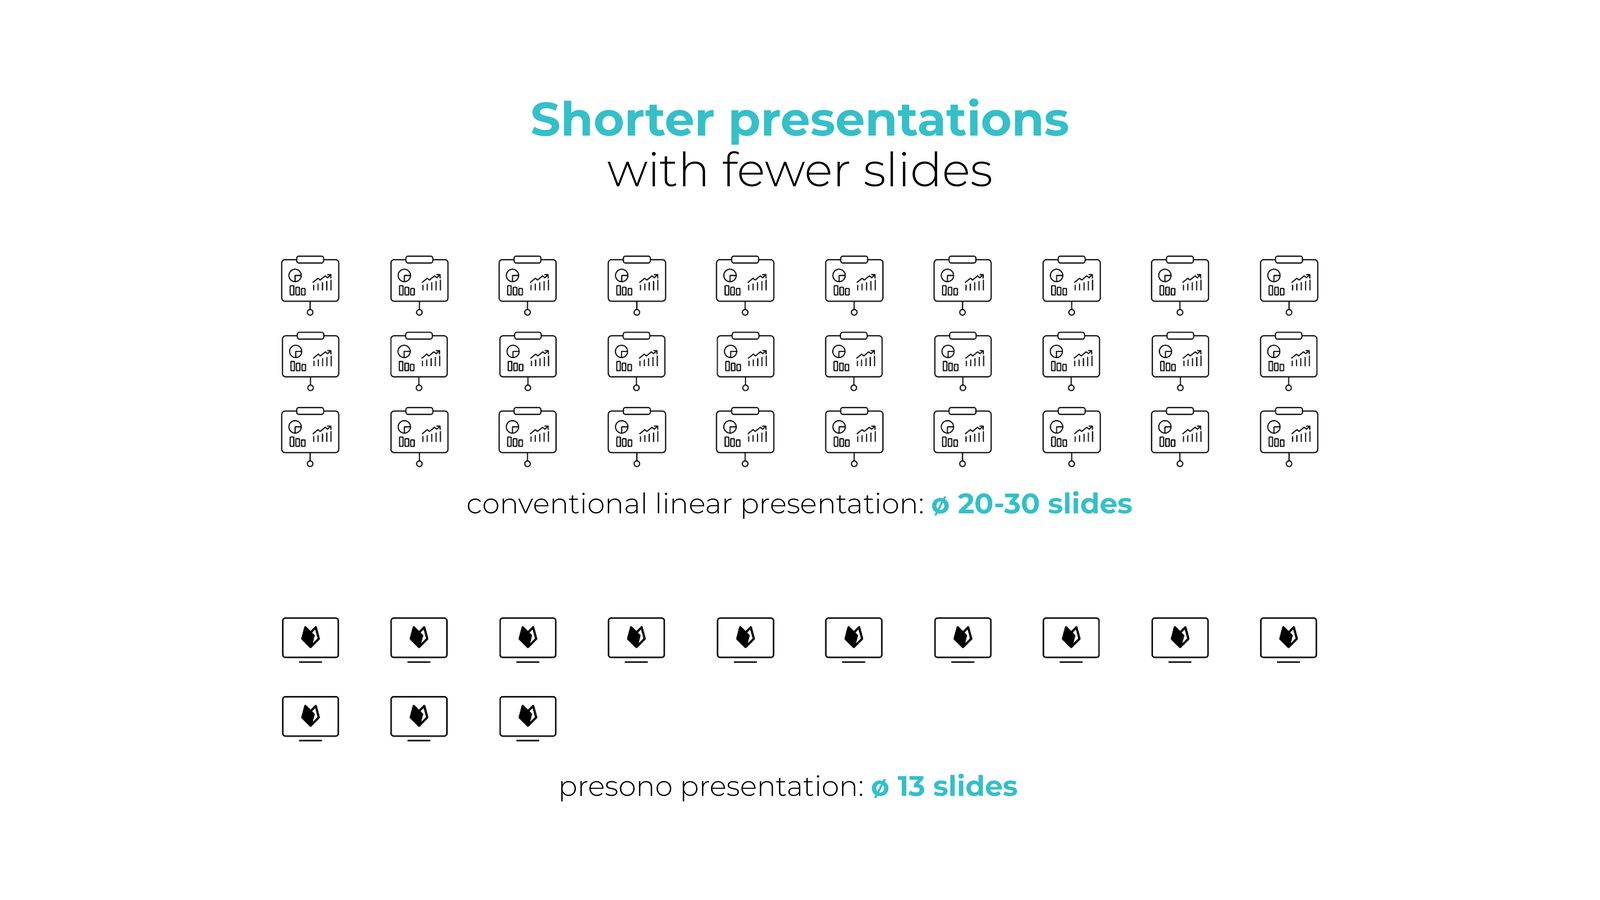
- A presentation gets by with 13 slides, instead of the usual 20 to 30.
- More than half of all content is reused: maintained once, up to date everywhere.
- It does not end with the meeting: shared presentations are opened ten times on average.
All figures in context: read the short version of the report.
Presenting is a full-time operation
589 presentations a year is more than two per working day. And not created, but shown: to customers, at trade fairs, in product meetings. Whether it is 50 or 5,000 in your company depends mainly on the size of the sales team. What matters are not the volumes but the patterns behind them, because those are the same across all company sizes.
Everyday work with classic slides costs time
Two studies describe what presentations cost in everyday work with classic slide software: around 260 hours per person and year, and 40 % of the time in the program goes into design and formatting. Three out of four externally used presentations do not comply with corporate design. Most people know this starting point: everyone builds their own version, and every version ages differently.

Shorter, because centrally maintained
In our data, the same everyday work looks different. A presono presentation has 13 slides on average, 44 % fewer than the benchmark for linear presentations. Not because there is less in it: overlays and media galleries bundle on one slide what is otherwise spread across many.
On top of that, 54 % of the content is reused, maintained centrally once and up to date everywhere. What is stored centrally is not reformatted in every presentation. Nine out of ten companies use interactive presentations for this, in sales, at trade fairs and in product communication.
After the meeting is when it really starts
Companies share up to 732 presentations externally per year, and each one is opened ten times on average. So the presentation is passed on after the conversation, often to people who were not in the room. That is exactly where decisions are made. Anyone who sees which content is viewed afterwards knows where to start when following up.

Eight days of K 2025, over 2,000 presentations
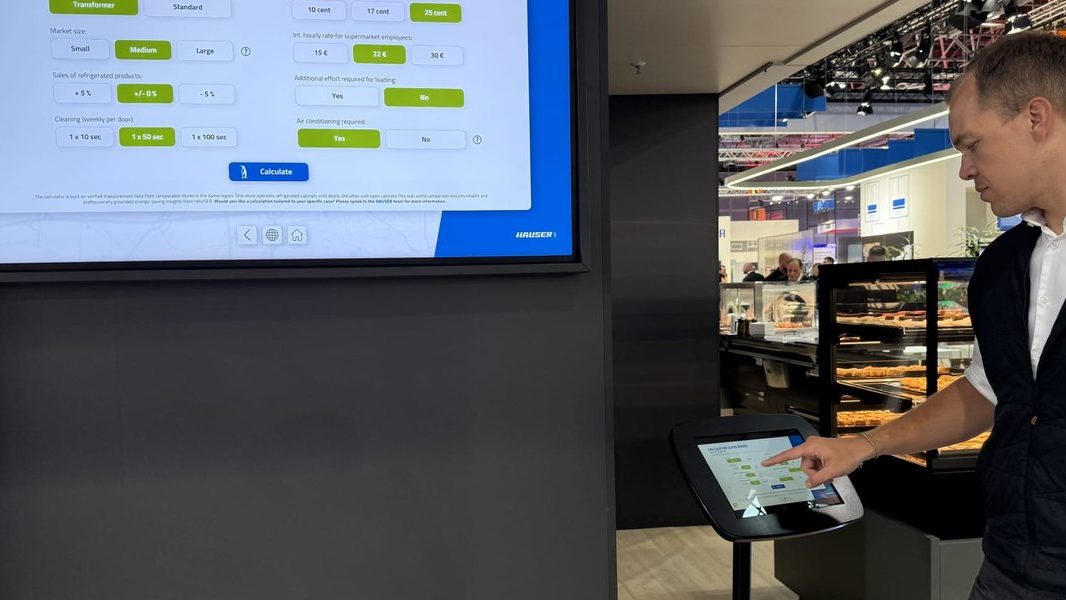
How far this goes is shown by K 2025, the world's leading trade fair for plastics. Ten companies showed over 2,000 presentations with presono there in eight days: at interactive stations and on touchscreens, on tablets and on employees' own devices, as product catalogue, visitor information and movie library, offline too, and via NFC right at the exhibit.

What should be settled before a trade fair appearance is in our trade fair checklist.
What sets the industries apart
Industry and mechanical engineering present significantly more than average, driven by products that need explaining and by large sales teams. Consumer-related industries fluctuate more, with seasons and campaigns. What stands out is the lead time: restraint often shows up in the number of presentations before it shows up in the economic indicators. Since the third quarter of 2024 we have seen a cautious stabilisation that continues into mid-2025.
What a presentation is worth
Usage data also allows a metric to be derived: Revenue per Presentation, the attributable revenue of a business unit divided by the presentations shown and shared there. There is no universally valid figure for it. Yours is different from your neighbour's. It becomes interesting over time: once the value is available twice, you have a basis for discussion. In the report we work through the calculation with an example.
Read the report
Present to Perform: read the short version
Eight pages as a PDF, no form: the key figures, industry development from 2021 to mid-2025, one industry average in detail and the Revenue per Presentation calculation. Put your own figures next to them. If you need the full analysis with all industry details, we will send it to you. A short email is all it takes.
Sources of the cited study figures: empower GmbH (2020), Die große globale PowerPoint-Studie (working time for presentations, share for design and formatting); GfK (2014), Die große Office-Studie, Made in Office GmbH (share of external presentations not compliant with corporate design); Slidey (2025), benchmark of 20 to 30 slides per linear presentation. Full list in the complete report. Photos: Vitaly Gariev/Unsplash (title image, tablet conversation), presono.
This article is based on our own usage data and the report "Present to Perform". AI tools supported the structuring, wording and image selection; content, figures and sources were editorially reviewed.